Illustrative Deployment Scenario
Large UK shopping centre
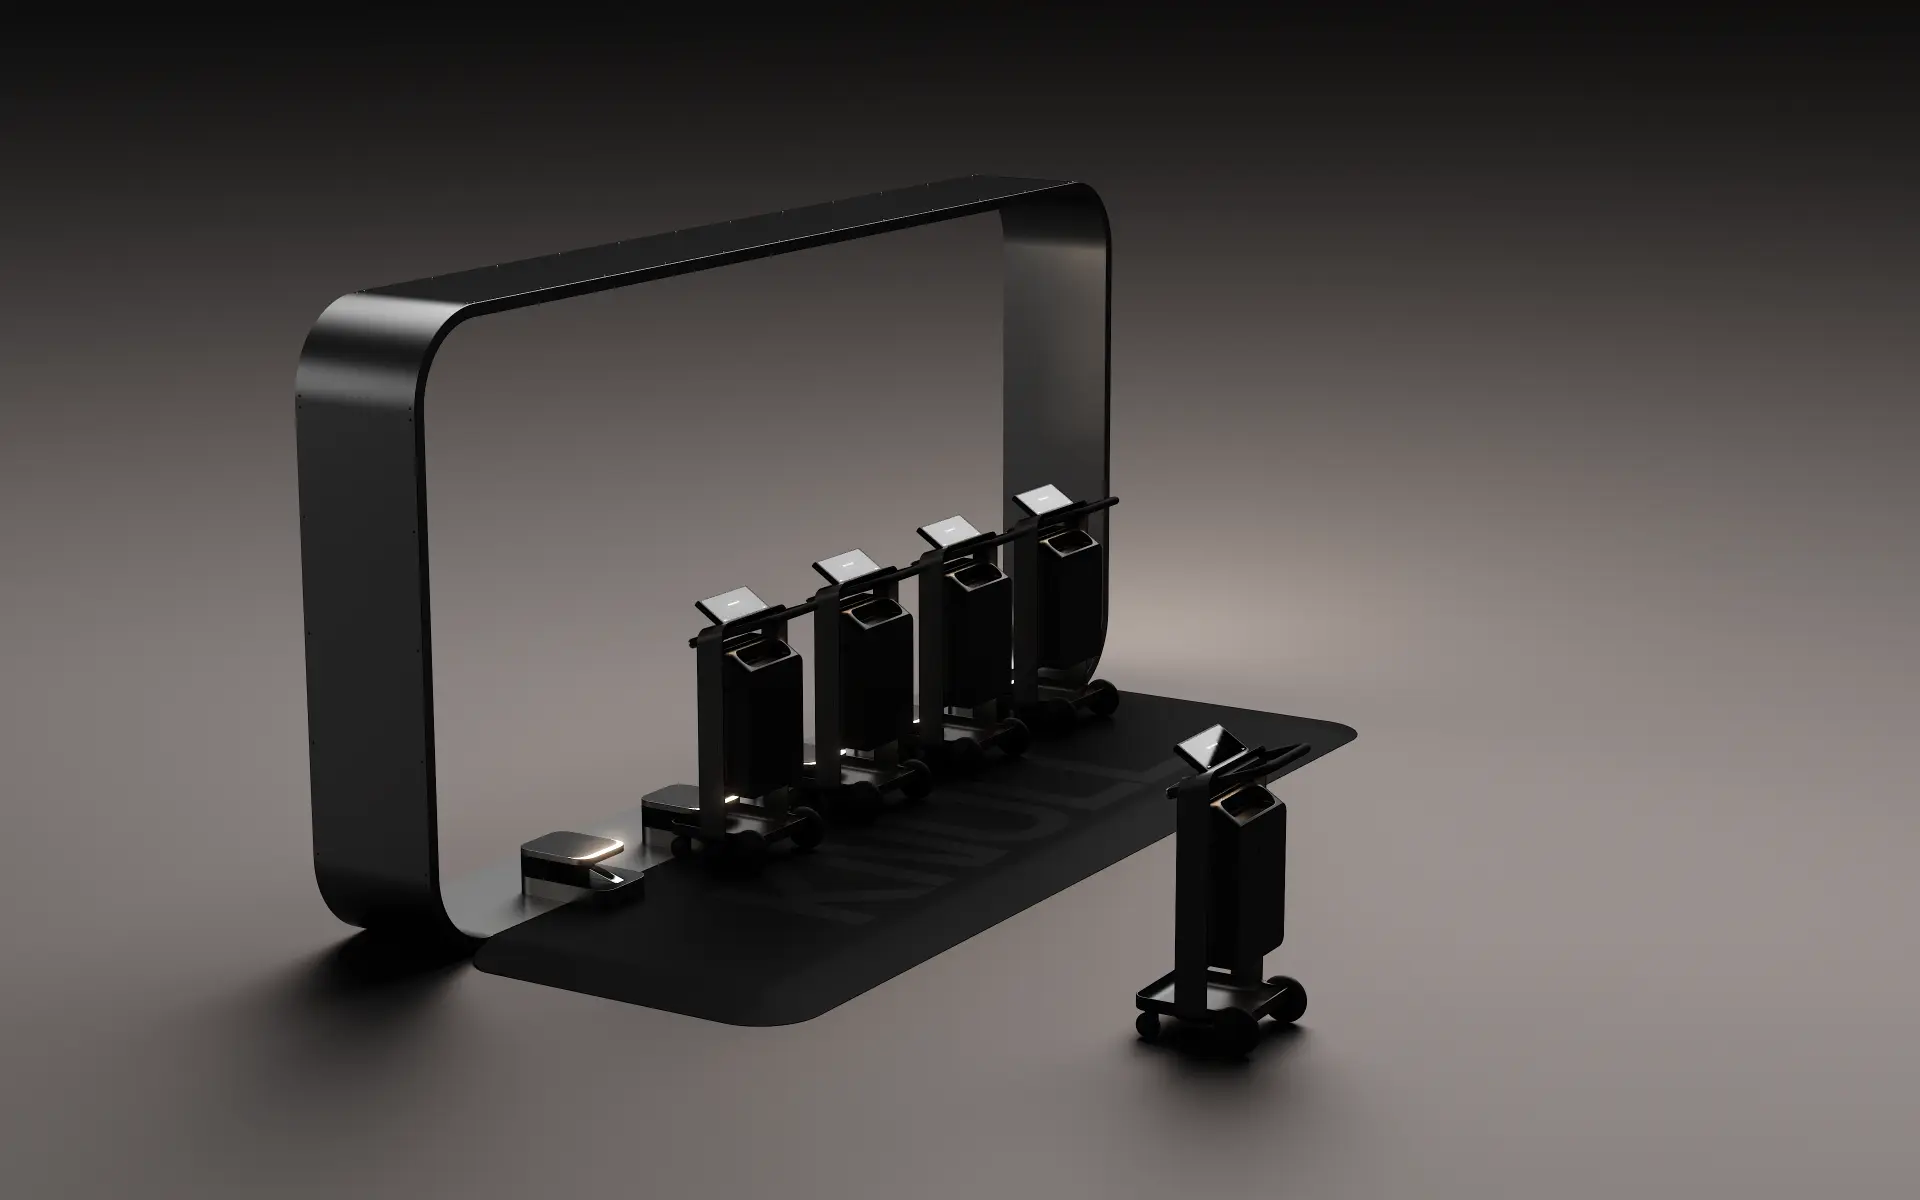
An illustration of how a fleet and dock network would be shaped for a large enclosed centre with several levels, multiple car park entrances and a long primary mall.
Hypothetical, not a case study
This is a hypothetical planning illustration produced by Knull. It is not a case study. It does not describe an existing customer, contract or measured result, and every figure shown is an assumption used to demonstrate how a deployment would be shaped.
- Format
- Enclosed, three retail levels
- Assumed footprint
- Long spine mall with two anchor ends
- Assumed access
- Multi-storey parking on two levels, four public entrances
- Assumed dwell
- Extended weekend dwell, shorter weekday visits
01The constraint
What actually makes this format hard.
In a centre of this shape the distance between where a shopper parks and where they finish shopping is the problem. A trolley taken from one entrance is rarely wanted back at that entrance, so units accumulate at the convenient end of the building and disappear from the other.
The operational cost is not the hardware. It is the staff time spent recovering units, and the shopper experience of arriving at a stand that is empty at exactly the moment it matters.
02Fleet
Fleet sized around concurrent sessions, not floor area
The illustrative approach sizes the fleet from peak concurrent sessions rather than square metres. Peak concurrency is estimated from footfall, the share of visitors likely to take a unit, and how long a typical session lasts.
A deployment of this shape would usually start below the modelled peak and grow, because early real utilisation is a better guide than any pre-launch estimate.
- Illustrative fleet at launch
- Sized to a modelled weekday peak
- Growth trigger
- Sustained peak-hour availability pressure
- Service reserve
- A share of the fleet held for maintenance rotation
03Dock network
Docks follow the walking route, not the plan drawing
Dock placement in an enclosed centre follows arrival and exit behaviour: where shoppers enter with intent, and where they stop carrying.
The network is designed so that no shopper has to walk back the way they came to return a unit. That single rule drives most of the placement decisions.
01
Car park lift and stair cores
The true arrival points, ahead of the mall entrances
02
Anchor store thresholds
Where shopping volume changes and units are picked up or released
03
Mall mid-point
Prevents accumulation at the two ends of a long spine
04
Transport and taxi exit
The natural end of a session for visitors without a car
04Shopper journey
How a single session would run.
Step 1
Arrive
Shopper parks and passes a dock at the lift core rather than hunting for a stand.
Step 2
Release
A unit is released at the dock through the app.
Step 3
Use
The unit moves between levels with the shopper across the visit.
Step 4
Return
The unit is returned to any dock in the network, typically nearest the exit used.
05Operations
What the operating day looks like.
Daily rhythm
Operations work from an exception list — docks approaching capacity, zones running short, units flagged for service — rather than sweeping the estate.
Redistribution
Movement between docks is prompted by dock pressure. In a spine-shaped centre this is usually a small number of moves at predictable times.
Service
Units flagged for service are rotated out during trading hours and replaced from the reserve, so availability at the dock is unaffected.
06Sequence
How it would be phased.
- 01
Discovery
Visitor behaviour, current provision, what the centre wants to change
- 02
Site assessment
Entrances, cores, power and connectivity at candidate dock locations
- 03
Deployment design
Dock network, fleet size, service model and ownership split
- 04
Pilot
A defined zone or level, with agreed measures before launch
- 05
Operate and learn
Utilisation, dock pressure and exceptions reviewed against the design
- 06
Scale
Extension across remaining levels and entrances
07Measurement
What would be measured.
- Availability at dock during peak trading hours.
- Utilisation per unit per operating day.
- Dock pressure by location and time of day.
- Service events and time to resolve them.
- Return distribution — whether units end their session where the design predicted.
Targets are agreed with the operator before launch, not asserted here.
More illustrations
Next step
Model this against your own site.
A site assessment replaces every assumption on this page with your entrances, your dwell pattern and your operating constraints.