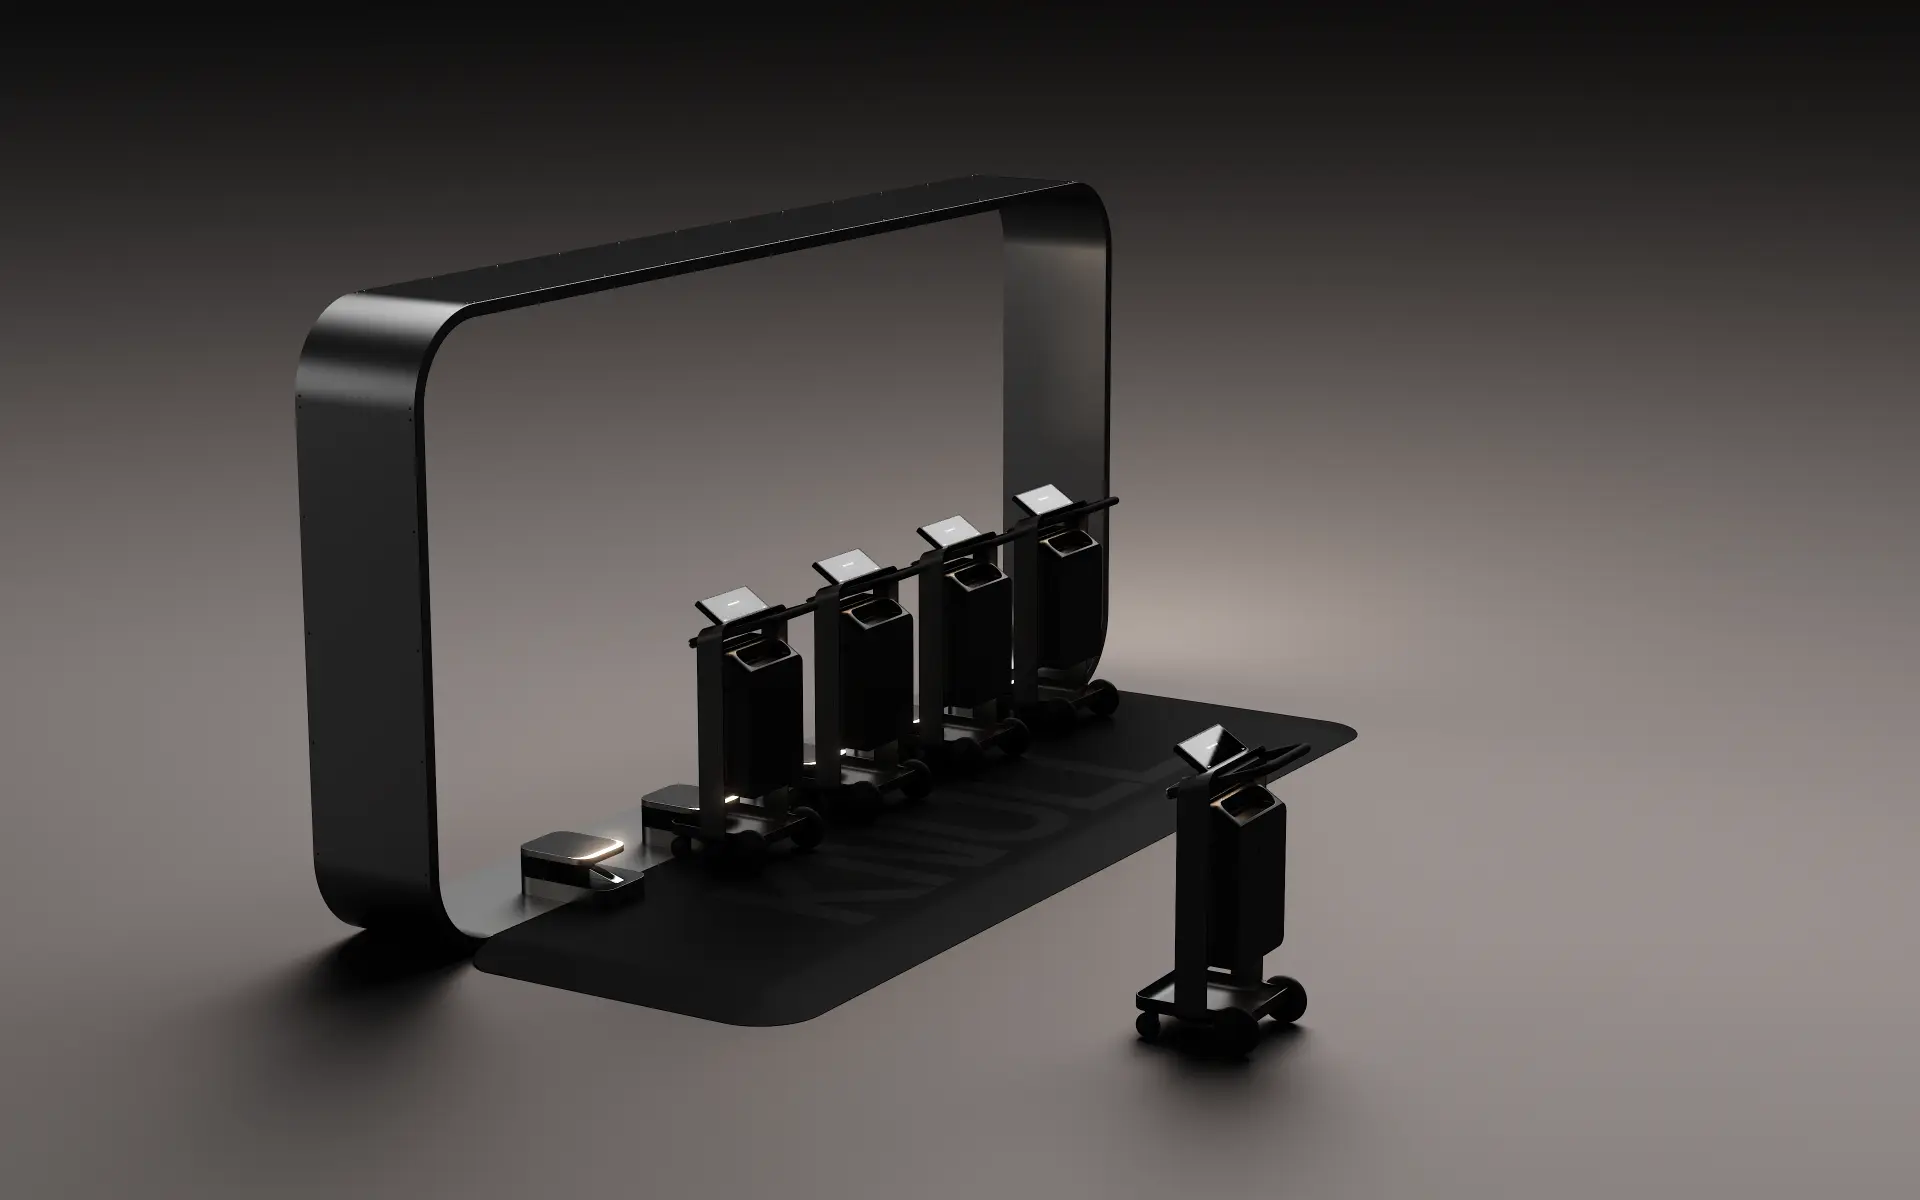
Platform · Operator console
The fleet, the docks
and the floor — in one view.
Hardware without software is inventory. The Knull platform turns a fleet of trolleys into managed infrastructure with measurable availability, predictable service and destination-level insight.
- View
- Per unit · dock · level
- Access
- Role-based
- Mode
- Exception-led
06Operator platform
Know what your fleet is doing.
Availability, dock capacity, sessions and service state in one view — per level, per dock, per unit. Operations stop being a walk-around and become a screen.
Overview
Illustrative data only- Units in fleet
- 24Illustrative
- Active sessions
- 18Illustrative
- Dock occupancy
- 62%Illustrative
- Units charging
- 4Illustrative
Utilisation by hour
Shape shown for illustration
Recent activity
- K1-PRO-07In sessionLevel 1 · North
- K1-CARRY-03DockedDock N-01
- K1-PRO-02ChargingDock W-03
- K1-FLEET-01Service dueLevel 2 · East
01Capabilities
Operations you can actually run.
The console is built around the questions an operations team asks during a trading day, in the order they ask them. Each capability lives in a named pane.
- OVERVIEW
Fleet visibility
Every unit is addressable: where it is, whether it is in session, docked, charging or held for service.
- DOCKS
Dock capacity
Occupancy per dock and per level, so units can be rebalanced before a shopper finds an empty island.
- SESSIONS
Session data
Duration, release point and return point per session, aggregated into patterns rather than surveillance.
- OVERVIEW
Availability targets
Track availability the way you track any other service level in the destination, against your own thresholds.
- ALERTS
Exceptions first
The console surfaces what needs attention — service due, dock offline, unit unreturned — instead of a wall of green.
- ANALYTICS
Destination insight
Flow between levels and zones, dwell patterns and peak windows — useful for leasing conversations as well as operations.
Pane names correspond to the illustrative console above
02Who it serves
Three teams, one source of truth.
Operations, centre management and commercial teams work from the same data with different views, so mobility stops being an anecdotal conversation.
Operations
“What needs attention on the floor right now?”
- Exception queue before the walk-around
- Dock occupancy per level for rebalancing
- Service state driving planned maintenance
Centre management
“Is mobility infrastructure performing?”
- Availability measured against your own target
- Utilisation across the trading week
- A defensible record for reporting lines
Commercial teams
“How do visitors actually move through the destination?”
- Movement between levels and zones
- Dwell patterns by window and by area
- Evidence for leasing, layout and campaign decisions
03System architecture
Where the data comes from, and where it goes.
Knull is introduced into a live environment with existing systems, existing teams and existing service standards. The platform is built to respect all three.
- 01
Unit
Each trolley reports identity, session and service state as it moves through the destination.
Local release and return continue if connectivity drops.
- 02
Dock
Docks handle retention, charging and release, and report occupancy per island.
Power and connectivity are surveyed per position at assessment.
- 03
Platform
State is consolidated into fleet, dock, session and exception views with role-based access.
Scoped permissions for site teams, management and head office.
- 04
Your systems
Designed to sit alongside existing footfall, facilities and CRM tooling rather than replace it.
Integration scope is agreed per destination during assessment.
Platform
Walk the console with our team.
We can run through fleet views, dock states and reporting against a destination of your size and layout.